<?xml version="1.0" encoding="utf-8"?><feed xmlns="http://www.w3.org/2005/Atom" ><generator uri="https://jekyllrb.com/" version="3.10.0">Jekyll</generator><link href="https://zhang-wenxi.github.io/feed.xml" rel="self" type="application/atom+xml" /><link href="https://zhang-wenxi.github.io/" rel="alternate" type="text/html" /><updated>2026-06-05T04:59:44+00:00</updated><id>https://zhang-wenxi.github.io/feed.xml</id><title type="html">Zhang Wen Xi</title><subtitle>Software Engineer and Product Manager specializing in ERP and AI solutions.</subtitle><author><name>wenxi</name></author><entry><title type="html">Zhang’s Tea Tableau Sales Dashboard</title><link href="https://zhang-wenxi.github.io/work/2026/06/03/Zhang-Tea-Tableau-SD.html" rel="alternate" type="text/html" title="Zhang’s Tea Tableau Sales Dashboard" /><published>2026-06-03T16:00:00+00:00</published><updated>2026-06-03T16:00:00+00:00</updated><id>https://zhang-wenxi.github.io/work/2026/06/03/Zhang-Tea-Tableau-SD</id><content type="html" xml:base="https://zhang-wenxi.github.io/work/2026/06/03/Zhang-Tea-Tableau-SD.html"><![CDATA[<p>Which store was quietly underperforming while everything else looked fine? The answer was not hidden in a complicated calculation. It was in the way the story was presented.</p>

<p>In this video I demo a Tableau sales dashboard built for a mockup of a retail database, Zhang’s Tea, simulated for this demo. One dashboard view driven by dynamic measures and action parameters that swap charts on click, reveal store level breakdowns on map hover, and surface weekly sales patterns without adding a single extra page.</p>

<div style="padding-left: 40px; margin-top: 20px; margin-bottom: 60px; clear: both;">
  <div style="position: relative; padding-bottom: 56.25%; height: 0; overflow: hidden; max-width: 100%;">
    <iframe width="560" height="315" src="https://www.youtube.com/embed/J51VXEBeg7g" title="YouTube video player" frameborder="0" allow="accelerometer; autoplay; clipboard-write; encrypted-media; gyroscope; picture-in-picture; web-share" referrerpolicy="strict-origin-when-cross-origin" allowfullscreen=""></iframe>
  </div>
</div>

<p>📊 KEY RESULTS
Sales dashboard with dynamic measures and action parameters that switch chart types on KPI click. Tooltip page design showing sales, quantity and customer count breakdown on symbol map hover.</p>

<p>🛠️ TECH STACK
Tableau Desktop · LOD Expressions · Parameter Actions · Federated Excel Source · Symbol Maps</p>

<p>🔍 WHAT MAKES THIS DIFFERENT
Most Tableau demos show one static page with numerous KPIs and charts. This build shows how a real multi-stakeholder report works with dynamic measures, action parameters and hover breakdown. Navigation and context replace page count. The insight surfaces with as little effort as possible from the person reading it.</p>

<p>Demo Data Notice: Dataset is based on a synthetic mockup of a Singapore retail tea business for portfolio demonstration purposes only.</p>]]></content><author><name>Zhang Wen Xi</name></author><category term="work" /><category term="Tableau" /><category term="Data Visualisation" /><summary type="html"><![CDATA[A single page Tableau sales dashboard built on dynamic measures and action parameters with symbol map tooltip design and federated Excel source for a synthetic Singapore retail tea business.]]></summary></entry><entry><title type="html">Amazing Mart EU storytelling Dashboard – Power BI Built from Scratch Design Thinking</title><link href="https://zhang-wenxi.github.io/work/2026/05/31/Amazing-Mart-EU-powerbi-buildfrscratch.html" rel="alternate" type="text/html" title="Amazing Mart EU storytelling Dashboard – Power BI Built from Scratch Design Thinking" /><published>2026-05-31T16:00:00+00:00</published><updated>2026-05-31T16:00:00+00:00</updated><id>https://zhang-wenxi.github.io/work/2026/05/31/Amazing-Mart-EU-powerbi-buildfrscratch</id><content type="html" xml:base="https://zhang-wenxi.github.io/work/2026/05/31/Amazing-Mart-EU-powerbi-buildfrscratch.html"><![CDATA[<p>Most Power BI tutorials just tell you what to click. This one teaches you why it works.
In this walkthrough, you’ll build a complete Sales Revenue Dashboard from scratch using the Amazing Mart EU dataset while actually understanding the building blocks behind every step.</p>

<p>What you’ll learn:
📥 Importing Excel data into Power BI
📊 Creating &amp; formatting charts with purpose
🧩 How reports are structured conceptually, not just visually
By the end, you won’t just have a dashboard. You’ll know how to think your way through building the next one.</p>

<div style="padding-left: 40px; margin-top: 20px; margin-bottom: 60px; clear: both;">
  <div style="position: relative; padding-bottom: 56.25%; height: 0; overflow: hidden; max-width: 100%;">
    <iframe width="560" height="315" src="https://www.youtube.com/embed/QPSXiUCMYqQ?si=lQ71SZk5U-zAwZdv" title="YouTube video player" frameborder="0" allow="accelerometer; autoplay; clipboard-write; encrypted-media; gyroscope; picture-in-picture; web-share" referrerpolicy="strict-origin-when-cross-origin" allowfullscreen=""></iframe>
  </div>
</div>]]></content><author><name>Zhang Wen Xi</name></author><category term="work" /><category term="Power BI" /><category term="Data Visualisation" /><summary type="html"><![CDATA[Power BI Built from Scratch Design Thinking on the Amazing Mart EU Sales Dashboard in Power BI — covering regional sales performance across Spain, Italy & Portugal, profit trends from 2011 to 2014, and why high sales doesn't always mean high profit.]]></summary></entry><entry><title type="html">Zhang’s Tea Power BI Sales Dashboard</title><link href="https://zhang-wenxi.github.io/work/2026/05/24/Zhang-Tea-PowerBI-SD.html" rel="alternate" type="text/html" title="Zhang’s Tea Power BI Sales Dashboard" /><published>2026-05-24T16:00:00+00:00</published><updated>2026-05-24T16:00:00+00:00</updated><id>https://zhang-wenxi.github.io/work/2026/05/24/Zhang-Tea-PowerBI-SD</id><content type="html" xml:base="https://zhang-wenxi.github.io/work/2026/05/24/Zhang-Tea-PowerBI-SD.html"><![CDATA[<p>What if every morning your sales team opened a mobile dashboard that already knew which district was underperforming, which product category was driving margin, and how far off budget the business was running?</p>

<p>In this video I demo a multi-page Power BI sales intelligence dashboard built for a mockup of a retail database, Zhang’s Tea, simulated for this demo. One data model and two dashboard views across laptop web version and mobile display version.</p>

<div style="padding-left: 40px; margin-top: 20px; margin-bottom: 60px; clear: both;">
  <div style="position: relative; padding-bottom: 56.25%; height: 0; overflow: hidden; max-width: 100%;">
    <iframe width="560" height="315" src="https://www.youtube.com/embed/ZUQH7UHIqNI?si=CNdxeYTbvWmY7ARG" title="YouTube video player" frameborder="0" allow="accelerometer; autoplay; clipboard-write; encrypted-media; gyroscope; picture-in-picture; web-share" referrerpolicy="strict-origin-when-cross-origin" allowfullscreen=""></iframe>
  </div>
</div>

<p>📊 KEY RESULTS</p>

<p>Sales Overview and Analysis dashboard on web and mobile with shared Year and District slicers. Tooltip page design showing city-level pie breakdown on map hover. Drill through product detail page.</p>

<p>🛠️ TECH STACK</p>

<p>Power BI Desktop · DAX · Power Query · Visual Maps · Decomposition Tree</p>

<p>🔍 WHAT MAKES THIS DIFFERENT</p>

<p>Most Power BI demos show one page with numerous KPIs and charts. This build shows how a real multi-stakeholder report works with storyboard page navigations, hover and drill-through details, and mobile screen design. Sales sees revenue vs target. Operations sees geographic volume. Each page answers a different business question from the same underlying model built in snowflake schema.</p>

<p>Demo Data Notice: Dataset is based on a synthetic mockup of a Singapore retail tea business for portfolio demonstration purposes only.</p>]]></content><author><name>Zhang Wen Xi</name></author><category term="work" /><category term="Power BI" /><category term="Data Visualisation" /><summary type="html"><![CDATA[A multi-page Power BI sales intelligence dashboard built on a single semantic model with storyboard navigation, mobile display, and drill-through product detail views for a synthetic Singapore retail tea business.]]></summary></entry><entry><title type="html">Data Sources That Matter in Power BI</title><link href="https://zhang-wenxi.github.io/writing/2026/05/23/PowerBI-connectors.html" rel="alternate" type="text/html" title="Data Sources That Matter in Power BI" /><published>2026-05-23T16:00:00+00:00</published><updated>2026-05-23T16:00:00+00:00</updated><id>https://zhang-wenxi.github.io/writing/2026/05/23/PowerBI-connectors</id><content type="html" xml:base="https://zhang-wenxi.github.io/writing/2026/05/23/PowerBI-connectors.html"><![CDATA[<p>Today, data does not come from one place. Sales orders sit in SAP. Leads live in Salesforce. Different departments run on different systems. Modern BI platforms connect easily to multiple data sources: Snowflake, Azure Synapse, even legacy SAP BW. Power BI’s Get Data is where this begins.</p>

<p>The connector you pick is not just a technical setting. It determines data latency, query performance, available features, and governance. The right way to think about it is this: what is the source, what path does the data take, and what does the report actually require. That framing drives every good connector decision.</p>

<h3 class="archive__subtitle">Microsoft Fabric: The Modern Data Stack</h3>

<p><img src="/assets/images/articles/powerbi/image2.png" alt="Microsoft Fabric Get Data sources" /></p>

<p>
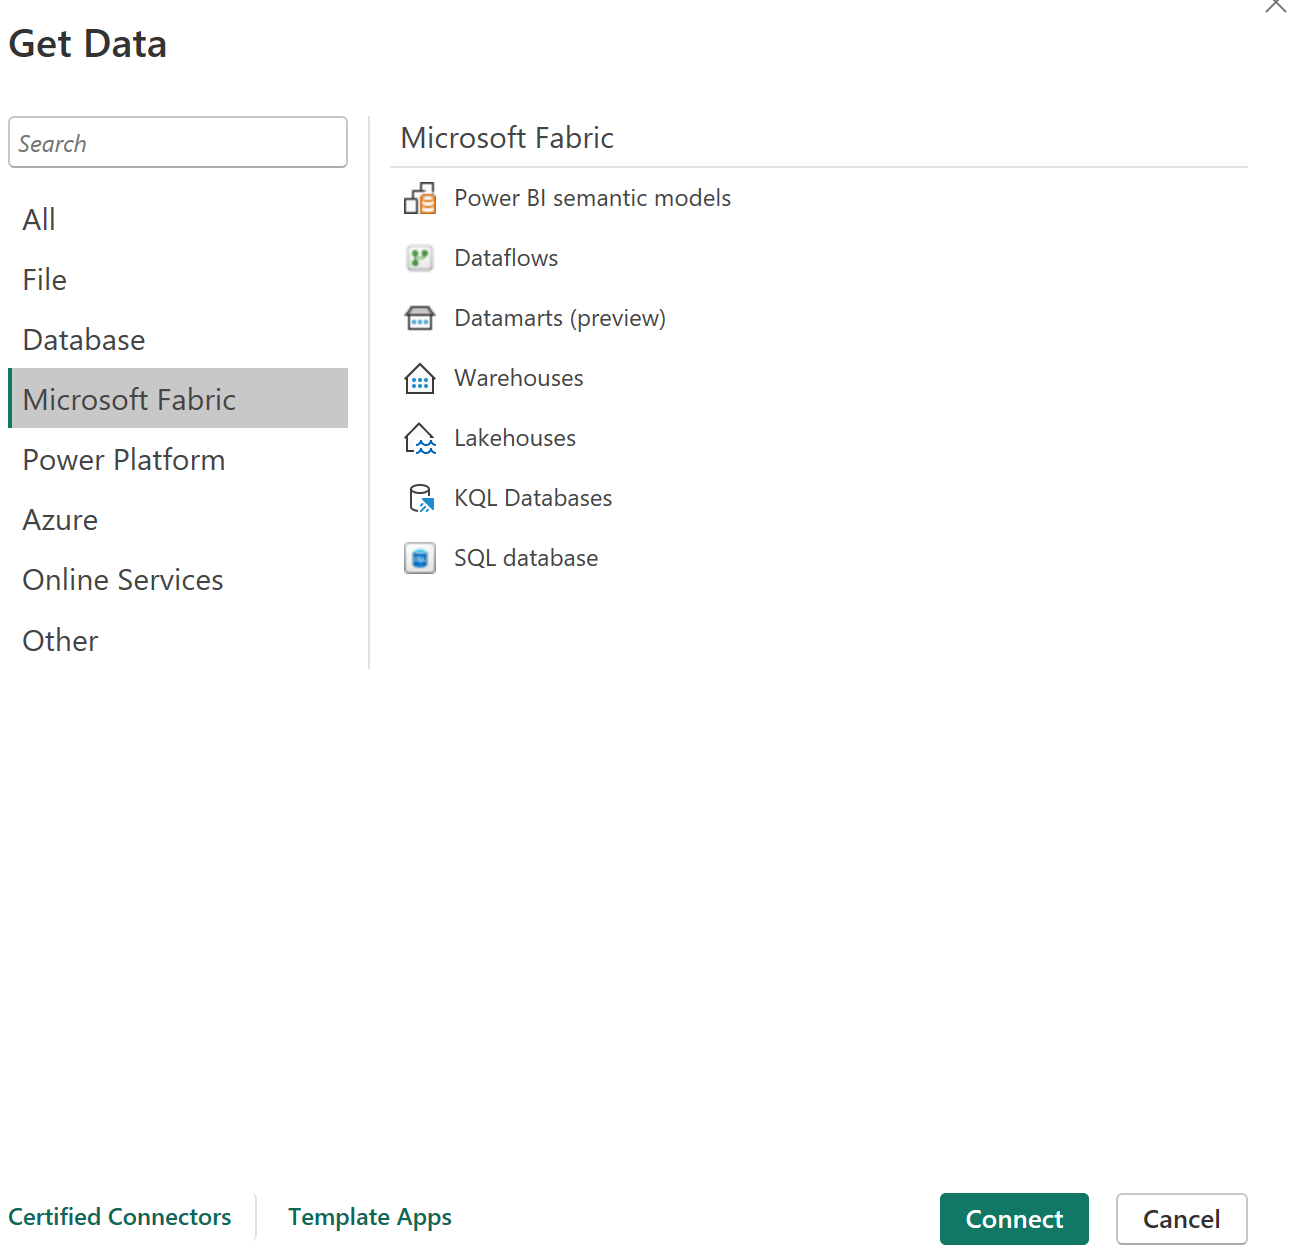
Microsoft Fabric unifies what was previously a collection of separate Azure services into a single capacity licence with a shared storage layer called <a href="https://learn.microsoft.com/en-us/fabric/onelake/onelake-overview">OneLake</a>. This changes how data platforms are built in Microsoft environments.</p>

<p>Within Fabric, transformation happens through Dataflows Gen 2 for low-code ingestion, pipelines for orchestration, and notebooks for code-first engineering. Lakehouses store data in open Delta format on OneLake, which is built on <a href="https://parquet.apache.org/docs/">Apache Parquet format</a> underneath. Pure data science workloads favour Parquet precisely because column names, data types, and nullability are encoded within the file itself. This removes dependency on an external schema definition and makes the data self-describing. They serve as the central landing zone that multiple reports and semantic models can share. Warehouses provide a SQL endpoint for structured analytical workloads. KQL Databases handle real-time event streams.</p>

<p>In a mature Fabric setup, Power BI does not connect to source systems directly at report time. It connects to governed Lakehouse or Warehouse tables that Dataflows Gen 2, pipelines, or notebooks have already prepared. The <a href="https://learn.microsoft.com/en-us/azure/architecture/example-scenario/analytics/enterprise-bi-microsoft-fabric">Microsoft Fabric enterprise BI guidance</a> is explicit on this point. The Get Data connector is the last step, not the first.</p>

<h3 class="archive__subtitle">Databases: The Relational Workhorses</h3>

<p><img src="/assets/images/articles/powerbi/image3.png" alt="Database Get Data sources" /></p>

<p>
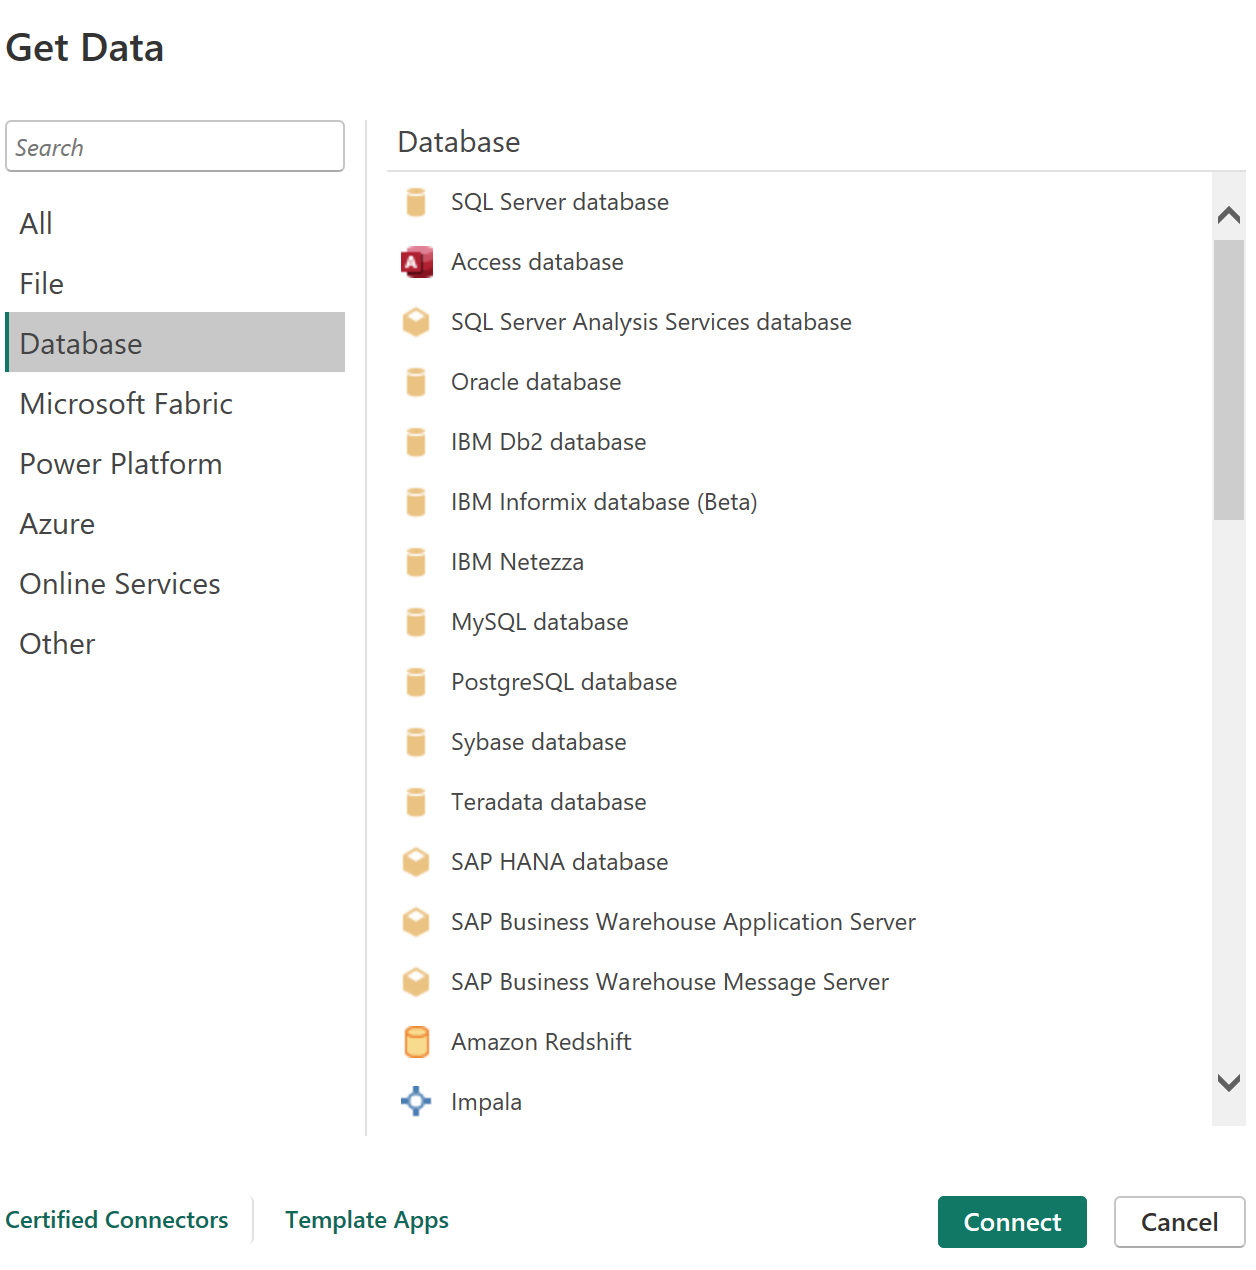
SQL Server, PostgreSQL, MySQL, Oracle, IBM Db2, and Amazon Redshift cover the most widely deployed data sources in enterprise environments.  These are well-understood sources with predictable query behaviour. They support both Import and DirectQuery connection modes. For many organisations that have not yet moved to cloud-native architecture, these remain the primary layer feeding Power BI reports. Amazon Redshift supports DirectQuery but Import mode is preferred in production for performance reasons.</p>

<p>SAP HANA deserves specific mention. Enterprises still running SAP BW connect through the BW connector rather than HANA DirectQuery. The CDS view approach applies to modern S/4HANA deployments. In SAP environments, ABAP developers write <a href="https://help.sap.com/docs/SAP_S4HANA_ON-PREMISE/ee6ff9b281d8448f96b4fe6c89f2bdc8/4ed1f2e06e391014adc9fffe4e204223.html">CDS views</a>, Core Data Services, directly on the HANA layer. A well-built CDS view handles joins, client filters, currency conversion, and authorisation checks. It presents a clean, business-ready data model without exposing raw SAP tables. Power BI connects to SAP HANA using DirectQuery, reading the CDS view live at query time. No import copy is maintained. The business logic stays in the SAP layer, maintained and versioned by the SAP team.</p>

<p>Pure DirectQuery on SAP HANA has <a href="https://learn.microsoft.com/en-us/power-bi/connect-data/desktop-directquery-about#limitations-and-considerations">known limits</a>. Cross-source joins are not supported unless Composite Mode is used. Some time intelligence DAX functions do not push down to the HANA engine. High-cardinality columns can degrade query performance. The practical solution is <a href="https://learn.microsoft.com/en-us/power-bi/transform-model/desktop-composite-models">Composite Mode</a>: import small reference and dimension tables, keep large fact tables on DirectQuery against HANA. This unlocks cross-source joins and preserves data freshness where it matters while maintaining report performance.</p>

<h3 class="archive__subtitle">Azure: Cloud-Native Sources</h3>

<p><img src="/assets/images/articles/powerbi/image1.png" alt="Azure Get Data sources" /></p>

<p>
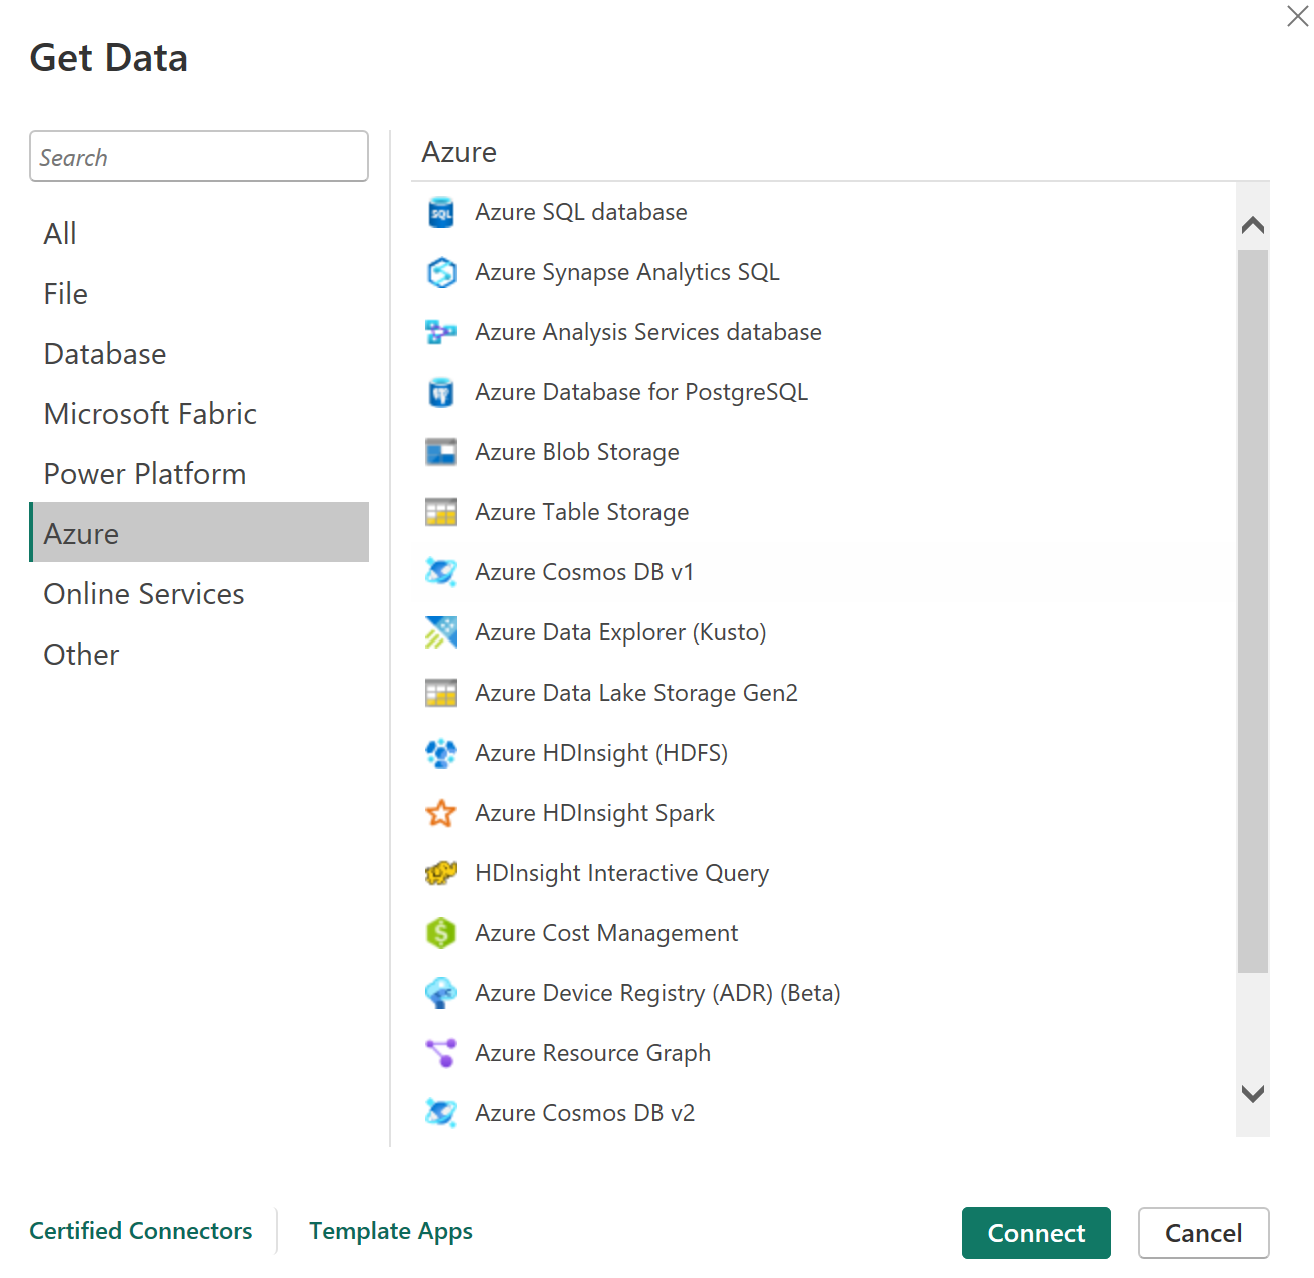
Azure SQL Database and Azure Synapse Analytics SQL are the primary cloud relational sources. Synapse handles large-scale analytical workloads. Synapse SQL pools remain widely deployed, but Fabric Warehouse is Microsoft’s strategic direction for cloud BI. Azure Data Lake Storage Gen2 connects to raw data zones. Azure Blob Storage covers unstructured file storage. Azure Cosmos DB supports NoSQL document workloads. Azure Data Explorer serves time-series and log analytics scenarios.</p>

<p>In hybrid environments where some workloads remain on-premise and others sit in Azure, these connectors bridge the two. Power BI developers are often the end consumers of Azure infrastructure that data engineering teams have already built. Knowing what sits behind a connector, and what it means for performance and data freshness, is what allows a practitioner to participate in architecture conversations meaningfully.</p>

<h3 class="archive__subtitle">The DirectQuery Effect on Page Refresh</h3>

<p><img src="/assets/images/articles/powerbi/image4.png" alt="Power BI Page Refresh settings" /></p>

<p>Every connector in Power BI delivers data through one of two modes. This is not a minor detail. It determines which features are available and how the report behaves in production.</p>

<p>Import mode copies a snapshot of source data into Power BI’s in-memory VertiPaq engine. Visuals render against this local copy. The data is only as current as the last <a href="https://learn.microsoft.com/en-us/power-bi/connect-data/refresh-scheduled-refresh">scheduled refresh</a>. Scheduled refresh is an Import mode concept. It runs on a defined interval in the Power BI Service and updates the snapshot.</p>

<p>DirectQuery sends a live query to the source system every time a visual renders or a filter is applied. There is no data copy. The data is always current. Scheduled refresh does not exist in DirectQuery because there is no snapshot to update. What you manage instead is query performance, caching strategy, and query reduction settings. Certain Power BI features including AI visuals and some DAX functions are only available in Import mode. Import mode unlocks the full Power BI feature set, while DirectQuery trades features for freshness.
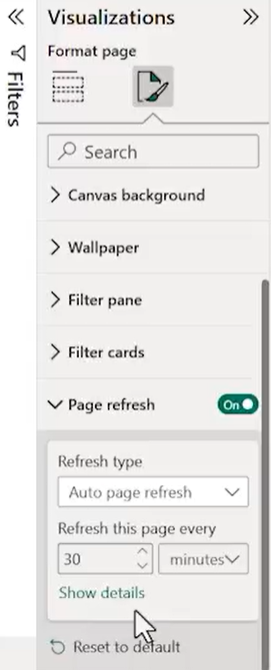
</p>

<p>The <a href="https://learn.microsoft.com/en-us/power-bi/create-reports/desktop-automatic-page-refresh">automatic page refresh</a> feature visible in the Format Page panel follows this same rule. It only appears when the report uses DirectQuery. It allows the report to re-query the source on a set interval, independent of the manual refresh button. For Import mode reports, the option is simply not present. This is not a gap. It is the expected consequence of the connection mode chosen at design time.</p>

<p>For SAP HANA via CDS views, DirectQuery with Composite Mode is typically the right architecture. The HANA engine handles live queries efficiently and the business requires current data. For large historical datasets in a relational database or Fabric Warehouse, Import mode with a well-scheduled refresh delivers better report performance and broader feature support. The decision is made at design time. Not after the report is built.</p>]]></content><author><name>Zhang Wen Xi</name></author><category term="writing" /><category term="Power BI" /><category term="Data Engineering" /><category term="Microsoft Fabric" /><summary type="html"><![CDATA[Multi-system data dynamics and the prominent sources powering modern analytics.]]></summary></entry><entry><title type="html">Amazing Mart EU Sales Dashboard – Power BI</title><link href="https://zhang-wenxi.github.io/work/2026/05/17/Amazing-Mart-EU-powerbi.html" rel="alternate" type="text/html" title="Amazing Mart EU Sales Dashboard – Power BI" /><published>2026-05-17T16:00:00+00:00</published><updated>2026-05-17T16:00:00+00:00</updated><id>https://zhang-wenxi.github.io/work/2026/05/17/Amazing-Mart-EU-powerbi</id><content type="html" xml:base="https://zhang-wenxi.github.io/work/2026/05/17/Amazing-Mart-EU-powerbi.html"><![CDATA[<p>🔍 Analyzing the Amazing Mart EU Sales Dashboard built in Power BI using the <a href="https://www.kaggle.com/">Kaggle Amazing Mart EU dataset</a>. This breakdown covers regional sales performance across Spain, Italy &amp; Portugal, profit trends from 2011 to 2014, and why high sales doesn’t always mean high profit.</p>

<div style="padding-left: 40px; margin-top: 20px; margin-bottom: 60px; clear: both;">
  <div style="position: relative; padding-bottom: 56.25%; height: 0; overflow: hidden; max-width: 100%;">
    <iframe width="560" height="315" src="https://www.youtube.com/embed/-iYL7gpfFYI?si=3ay0Uo7xsjrfwEml" title="YouTube video player" frameborder="0" allow="accelerometer; autoplay; clipboard-write; encrypted-media; gyroscope; picture-in-picture; web-share" referrerpolicy="strict-origin-when-cross-origin" allowfullscreen=""></iframe>
  </div>
</div>]]></content><author><name>Zhang Wen Xi</name></author><category term="work" /><category term="Power BI" /><category term="Data Visualisation" /><summary type="html"><![CDATA[Analyzing the Amazing Mart EU Sales Dashboard in Power BI — covering regional sales performance across Spain, Italy & Portugal, profit trends from 2011 to 2014, and why high sales doesn't always mean high profit.]]></summary></entry><entry><title type="html">AI Powered Job Scorecard Engine</title><link href="https://zhang-wenxi.github.io/work/2026/05/07/Job-Analysis-Scorecard.html" rel="alternate" type="text/html" title="AI Powered Job Scorecard Engine" /><published>2026-05-07T16:00:00+00:00</published><updated>2026-05-07T16:00:00+00:00</updated><id>https://zhang-wenxi.github.io/work/2026/05/07/Job-Analysis-Scorecard</id><content type="html" xml:base="https://zhang-wenxi.github.io/work/2026/05/07/Job-Analysis-Scorecard.html"><![CDATA[<p>I built an  end-to-end agentic AI job discovery system (<a href="https://huggingface.co/spaces/zhang-wenxi/job-score-analysis">HuggingFace</a>) that fetches job postings, screens for quality and authenticity, scores CV-to-job fit with LLM agents, enriches with full job descriptions, and ranks via the Skills Framework. Surfaced in a Streamlit dashboard.</p>
<div style="padding-left: 40px; margin-top: 20px; margin-bottom: 60px; clear: both;">
  <div style="position: relative; padding-bottom: 56.25%; height: 0; overflow: hidden; max-width: 100%;">
    <iframe src="https://www.youtube.com/embed/rciYHO-s2fo" style="position: absolute; top: 0; left: 0; width: 100%; height: 100%; border: 0;" allowfullscreen=""></iframe>
  </div>
</div>]]></content><author><name>Zhang Wen Xi</name></author><category term="work" /><category term="AI" /><summary type="html"><![CDATA[An end-to-end agentic AI job discovery system that fetches job postings, screens for quality and authenticity, scores CV-to-job fit with LLM agents, enriches with full job descriptions, and ranks via the Skills Framework, surfaced in a Streamlit dashboard.]]></summary></entry><entry><title type="html">Feature Engineering Drives More Improvement Than Hyperparameter Tuning</title><link href="https://zhang-wenxi.github.io/writing/2026/04/29/ML-Features.html" rel="alternate" type="text/html" title="Feature Engineering Drives More Improvement Than Hyperparameter Tuning" /><published>2026-04-29T16:00:00+00:00</published><updated>2026-04-29T16:00:00+00:00</updated><id>https://zhang-wenxi.github.io/writing/2026/04/29/ML-Features</id><content type="html" xml:base="https://zhang-wenxi.github.io/writing/2026/04/29/ML-Features.html"><![CDATA[<p>The DataCo Late Delivery Predictor is an end-to-end MLOps pipeline trained on 180,000 shipment records. It predicts late deliveries before they ship.</p>

<table style="margin-left: 2.5em; border-collapse: collapse;">
  <thead>
    <tr>
      <th style="text-align: left; padding-right: 3em; font-weight: 600;">Metric</th>
      <th style="text-align: left; font-weight: 600;">Value</th>
    </tr>
  </thead>
  <tbody>
    <tr>
      <td style="text-align: left; padding-right: 3em;">F1-weighted score</td>
      <td style="text-align: left;">0.69</td>
    </tr>
    <tr>
      <td style="text-align: left; padding-right: 3em;">Improvement vs. DummyClassifier baseline</td>
      <td style="text-align: left;">+66%</td>
    </tr>
    <tr>
      <td style="text-align: left; padding-right: 3em;">Validation method</td>
      <td style="text-align: left;">37-month walk-forward backtest</td>
    </tr>
    <tr>
      <td style="text-align: left; padding-right: 3em;">Top SHAP driver</td>
      <td style="text-align: left;">Shipping mode</td>
    </tr>
  </tbody>
</table>

<h3 class="archive__subtitle">Why Feature Engineering Comes First</h3>

<p>Feature engineering creates new signal. Hyperparameter tuning optimises within existing signal. If the signal is weak, tuning cannot rescue it.</p>

<p>In this dataset, shipping mode was the top driver of late deliveries according to <a href="https://shap.readthedocs.io/en/latest/">SHAP analysis</a>. That column existed raw in the data. Other derived features required construction. Days since last shipment per customer-supplier pair. Rolling average delay by route over 30-day windows. A port congestion flag derived from external weather and holiday data. Each derived feature added measurable lift. Hyperparameter tuning alone could not have discovered these patterns.</p>

<p>In this project, feature engineering on domain variables produced the majority of the lift. Hyperparameter tuning added incremental gains on top of that foundation.</p>

<h3 class="archive__subtitle">What the Full Pipeline Includes</h3>

<p>The project uses standard MLOps tooling for reproducibility. <a href="https://www.zenml.io/">ZenML</a> handles pipeline orchestration. <a href="https://mlflow.org/">MLflow</a> manages experiment tracking and the model registry. Validation uses a 37-month walk-forward backtest, not a cherry-picked holdout split. <a href="https://shap.readthedocs.io/en/latest/">SHAP</a> provides model explainability. Evidently monitors for data drift with rollback capability. A Streamlit executive dashboard surfaces the business cost of each wrong prediction, because a false negative in late delivery has a real dollar figure attached to it.</p>

<p>Most ML demos stop at the notebook. This one does not.</p>

<p>The code is available on <a href="https://github.com/zhang-wenxi">GitHub</a>.</p>

<h3 class="archive__subtitle">When to Tune Anyway</h3>

<p>Hyperparameter tuning is not useless. It adds value after feature engineering is exhausted. The mistake is doing tuning first, or only.</p>

<table style="margin-left: 2.5em; border-collapse: collapse;">
  <thead>
    <tr>
      <th style="text-align: left; padding-right: 3em; font-weight: 600;">Priority</th>
      <th style="text-align: left; padding-right: 3em; font-weight: 600;">Activity</th>
      <th style="text-align: left; font-weight: 600;">Impact</th>
    </tr>
  </thead>
  <tbody>
    <tr>
      <td style="text-align: left; padding-right: 3em;">1</td>
      <td style="text-align: left; padding-right: 3em;">Feature engineering</td>
      <td style="text-align: left;">High (primary driver of lift)</td>
    </tr>
    <tr>
      <td style="text-align: left; padding-right: 3em;">2</td>
      <td style="text-align: left; padding-right: 3em;">Hyperparameter tuning</td>
      <td style="text-align: left;">Incremental (adds on top)</td>
    </tr>
  </tbody>
</table>

<h3 class="archive__subtitle">The Decision Order Matters</h3>

<p>Build the right features first. Then tune. The decision order matters. Not after the model is deployed.</p>]]></content><author><name>Zhang Wen Xi</name></author><category term="writing" /><category term="Machine Learning" /><category term="Supply Chain" /><summary type="html"><![CDATA[A case study from the DataCo Late Delivery Predictor.]]></summary></entry><entry><title type="html">DataCo MLOps Pipeline</title><link href="https://zhang-wenxi.github.io/work/2026/04/14/mlops-dataco-pipeline.html" rel="alternate" type="text/html" title="DataCo MLOps Pipeline" /><published>2026-04-14T16:00:00+00:00</published><updated>2026-04-14T16:00:00+00:00</updated><id>https://zhang-wenxi.github.io/work/2026/04/14/mlops-dataco-pipeline</id><content type="html" xml:base="https://zhang-wenxi.github.io/work/2026/04/14/mlops-dataco-pipeline.html"><![CDATA[<p>I built end-to-end MLOps binary classification engine (<a href="https://huggingface.co/spaces/zhang-wenxi/dataco">HuggingFace</a> / <a href="https://dataco.streamlit.app">Streamlit</a>)
with ZenML, MLflow, XGBoost stacking ensemble and SHAP; F1-weighted 0.689 for supply chain late-delivery prediction</p>
<div style="padding-left: 40px; margin-top: 20px; margin-bottom: 60px; clear: both;">
  <div style="position: relative; padding-bottom: 56.25%; height: 0; overflow: hidden; max-width: 100%;">
    <iframe src="https://www.linkedin.com/embed/feed/update/urn:li:ugcPost:7454719654746435585?compact=1" style="position: absolute; top: 0; left: 0; width: 100%; height: 100%; border: 0;" allowfullscreen=""></iframe>
  </div>
</div>]]></content><author><name>Zhang Wen Xi</name></author><category term="work" /><category term="Machine Learning" /><summary type="html"><![CDATA[Built end-to-end MLOps binary classification engine with ZenML, MLflow, XGBoost stacking ensemble and SHAP; F1-weighted 0.689 for supply chain late-delivery prediction]]></summary></entry><entry><title type="html">Local LLM Chainlit interface</title><link href="https://zhang-wenxi.github.io/work/2026/04/09/Chainlit_demo.html" rel="alternate" type="text/html" title="Local LLM Chainlit interface" /><published>2026-04-09T16:00:00+00:00</published><updated>2026-04-09T16:00:00+00:00</updated><id>https://zhang-wenxi.github.io/work/2026/04/09/Chainlit_demo</id><content type="html" xml:base="https://zhang-wenxi.github.io/work/2026/04/09/Chainlit_demo.html"><![CDATA[<p>𝗖𝗵𝗮𝗶𝗻𝗹𝗶𝘁 ↔ 𝗢𝗹𝗹𝗮𝗺𝗮 𝗕𝗿𝗶𝗱𝗴𝗲 The connection is established with 𝗤𝘄𝗲𝗻𝟮.𝟱-𝗖𝗼𝗱𝗲𝗿.</p>
<div style="padding-left: 40px; margin-top: 20px; margin-bottom: 60px; clear: both;">
  <div style="position: relative; padding-bottom: 56.25%; height: 0; overflow: hidden; max-width: 100%;">
    <iframe src="https://www.linkedin.com/embed/feed/update/urn:li:ugcPost:7447926077672390656?compact=1" style="position: absolute; top: 0; left: 0; width: 100%; height: 100%; border: 0;" allowfullscreen=""></iframe>
  </div>
</div>]]></content><author><name>Zhang Wen Xi</name></author><category term="work" /><category term="AI" /><summary type="html"><![CDATA[𝗖𝗵𝗮𝗶𝗻𝗹𝗶𝘁 ↔ 𝗢𝗹𝗹𝗮𝗺𝗮 𝗕𝗿𝗶𝗱𝗴𝗲 The connection is established with 𝗤𝘄𝗲𝗻𝟮.𝟱-𝗖𝗼𝗱𝗲𝗿]]></summary></entry><entry><title type="html">Jobseeker Portal</title><link href="https://zhang-wenxi.github.io/work/2026/03/01/Jobseekers-Dashboard.html" rel="alternate" type="text/html" title="Jobseeker Portal" /><published>2026-03-01T16:00:00+00:00</published><updated>2026-03-01T16:00:00+00:00</updated><id>https://zhang-wenxi.github.io/work/2026/03/01/Jobseekers-Dashboard</id><content type="html" xml:base="https://zhang-wenxi.github.io/work/2026/03/01/Jobseekers-Dashboard.html"><![CDATA[<p>This dashboard proves that fairness is a structure, not a guessing game. By anchoring individual estimates against broad market data, we ensure the ‘weight’ of a role matches the ‘width’ of the reward. We aren’t just tracking salaries; we are measuring impact.</p>
<div style="padding-left: 40px; margin-top: 20px; margin-bottom: 60px; clear: both;">
  <div class="streamlit-container" style="position: relative; padding-bottom: 56.25%; height: 0; overflow: hidden; max-width: 100%; margin-top: 20px;">
    <iframe src="https://jobmarketsalary.streamlit.app/?embed=true" style="position: absolute; top: 0; left: 0; width: 100%; height: 100%; border: 0;" allowfullscreen="">
    </iframe>
  </div>
</div>]]></content><author><name>Zhang Wen Xi</name></author><category term="work" /><category term="Data Visualisation" /><category term="Streamlit" /><summary type="html"><![CDATA[This is a data visualisation dashboard for job seekers to analysis fair salary in the job market.]]></summary></entry></feed>